The Food Label Gets a Makeover: 7 Changes to Know
Whether you’re keeping track of your macros, or simply monitoring the intake of nutrients your kids eat daily, there is no doubt that the nutritional facts chart provides valuable information. Registered dietitian Sally breaks down the complexities of the updated chart that can sometimes feel overwhelming to understand.
Some people say that food labels don’t matter as long as you’re choosing healthy foods.
But I disagree–food labels reveal a lot. That “healthy” chia muffin might contain a day’s worth of added sugar, and that hearty-looking “cracked wheat” bread could have zero fiber. You won’t know unless you look at the label.
And now those labels are new and improved because after 20 years, the Nutrition Facts Panel got a little makeover.
You’ve probably seen the new label already, since large manufacturers were required by the FDA to start using it last month. Smaller companies have another year to comply.
The new label is designed to make it easier for you to make choices–and reflect more current knowledge about nutrition.
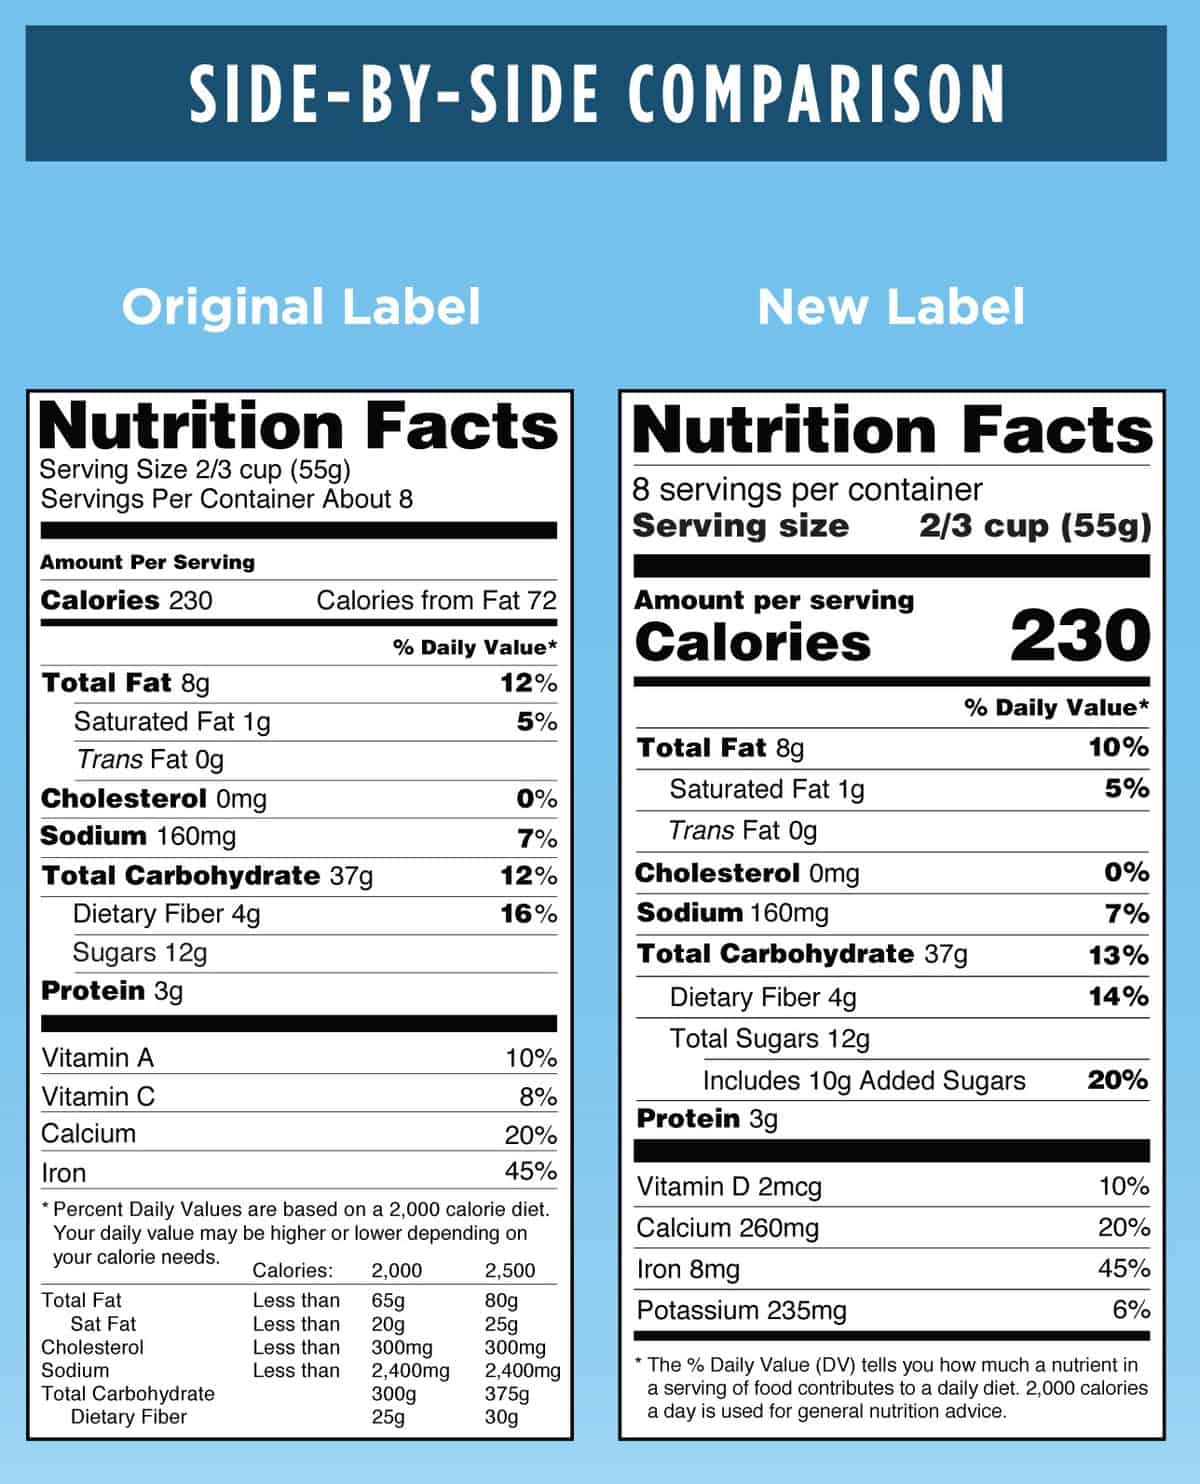
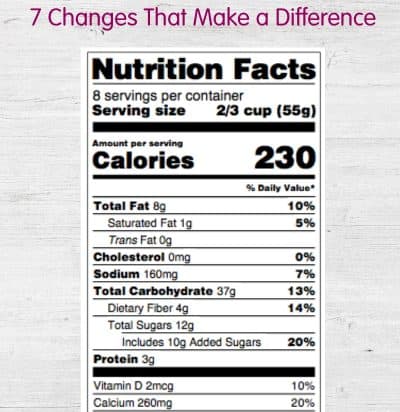
Here are the biggest changes to know about the new food label:
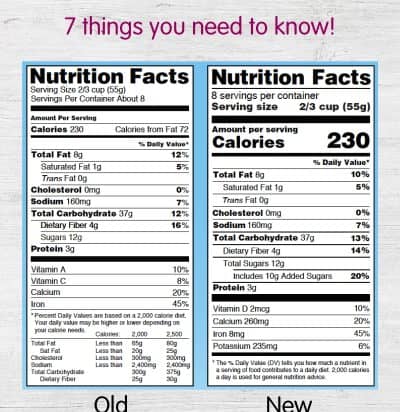
Key information is easier to spot.
You’ll see a larger font for calories, serving size and servings per container. That’s an important starting point for reading the rest of the label, so the FDA wanted to make sure those values stood out.
Serving sizes are realistic.
Serving sizes have changed to better represent how much people actually eat and drink. A serving of soda went from 8 ounces to 12 ounces, the size of a standard soda can. A serving of ice cream has grown from ½ cup to ⅔ cup (which, let’s face it, is probably still too small!). And if a product comes in what looks like a single serving container but isn’t (like a 20-ounce bottle of lemonade or a small two-serving bag of chips), manufacturers must list the calories and nutrients for the whole package as well as just one serving.
Sugar makes more sense.
There’s so much emphasis on limiting sugar, but food labels have been confusing for items like fruit, milk, and plain yogurt, which all contain natural sugar–not the type you need to limit. On the new label, “added sugar” (the kind put in by manufacturers in the form of table sugar, honey, and other sweeteners) must be listed below total sugar. There’s also a Daily Value listed for added sugar: 50g or about 10% of total calories.
Looking to cut added sugars in your diet? Check out this episode of Food Rx for more tips.
Outdated info was scrapped.
Remember when fat was the enemy? With much less obsession over avoiding fat–and science to show that it’s the kind of fat that matters, not how much–”calories from fat” was cut from the label. I say, good riddance!
There’s new advice about sodium and fiber.
The Daily Value for sodium decreased from 2,400mg to 2,300mg–so your favorite canned soup or frozen dinner might look a little higher in salt. But the Daily Value for fiber has increased from 25g per day to 28g because there’s so much research linking high-fiber diets with better health.
How much fiber should your family be getting? Check out this post for tips and ideas to eat more.
Vitamin D and potassium get some spotlight.
Vitamin D and potassium must now be listed on the label because they’re “nutrients of concern” that most people don’t get enough of. On the other hand, values for Vitamins A and C aren’t required anymore, since they’re easier to get.
Daily Values are (sort of) demystified.
Percent Daily Values are confusing, so the new label includes a little footnote explaining them: “The % Daily Value tells you how much a nutrient in a serving of food contributes to a daily diet.” Still confused? Think of Daily Values as general daily recommended amounts (or limits) of nutrients. The percentages on the label tell you how much that food contributes toward the Daily Value. A quick and dirty tip on Daily Values: 5 percent or less is low (good for things like sodium), 20 percent or more is considered high (good for things like fiber).


I hope they made the allergen list larger and easier to find! Much more important info to many of us.